
Sine excitation
The internal DAC source outputs one frequency at a time, stepping across the band to avoid broadband excitation noise and leakage.
Frequency Response & Impedance Analyzer
Starting from two-channel gain/phase sweeps, we are building a complete frequency-domain and impedance measurement platform. The current unit is an engineering prototype; impedance analysis will use a vector-cancellation balanced bridge, and VNA is on the roadmap.

Form factor is illustrative; the four-terminal interface and final enclosure are subject to change.
APPROACH
Many questions about filters, amplifiers, loop stability, and components ultimately reduce to a frequency-response curve. FRA-100 starts with stepped-sine excitation and two-channel ratio measurement, makes gain and phase reliable, then extends toward impedance and VNA.
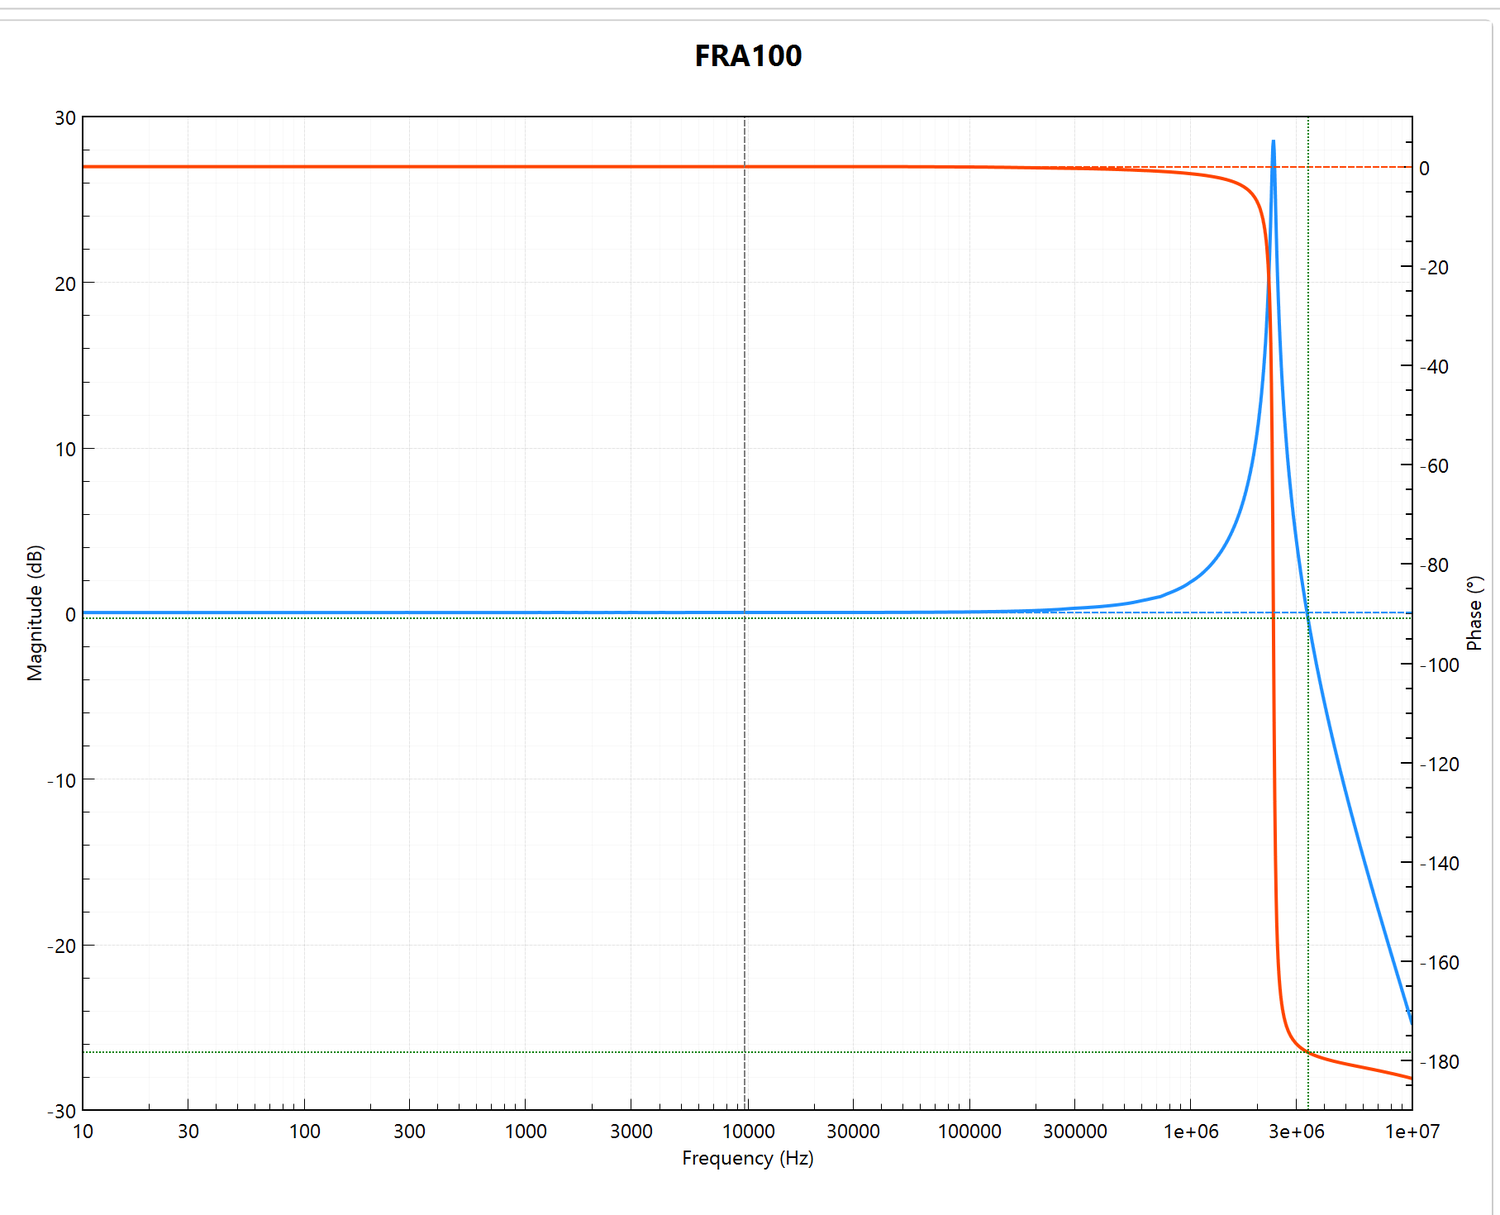
Measured: 10 Hz–10 MHz, 2,000 points, 100 Hz RBW, 50 Ω.
MEASUREMENT PRINCIPLE
A single sine wave is generated at each frequency; input and output are measured together, and the complex ratio gives magnitude and phase.
The internal DAC source outputs one frequency at a time, stepping across the band to avoid broadband excitation noise and leakage.
Two receive channels sample the DUT input and output together; the FPGA performs digital down-conversion and a narrow-band single-bin DFT.
H = ADC1 / ADC0 gives magnitude and phase. The ratio cancels common source, clock, and some channel drift, keeping the result closer to the DUT itself.
Narrow-band detection means the receiver only “sees” the current test frequency, rejecting out-of-band noise and interference — useful for small signals and high dynamic range.
CURRENT PROTOTYPE
The following capabilities have been validated on real hardware. The UI and specifications will continue to evolve.
Magnitude and phase traces, linear or logarithmic spacing, start/stop or center/span.
201 points by default, up to 20,001; receiver bandwidth from 1 Hz to 5 kHz.
Live trace updates; left/right cursors for frequency, magnitude, phase, and delta.
Save CSV measurement data and PNG plots for Excel, MATLAB, or Python.
1 GbE connection, TCP 5025 SCPI; a Windows host app handles setup, display, and export.
Real-time warning when the input approaches full scale, avoiding clipping errors.
MEASURED EXAMPLE
This is a 10 Hz–10 MHz sweep captured with the current engineering prototype and the FRA100 Control host app: 2,000 points, 100 Hz RBW, 50 Ω nominal impedance. The DUT shows a clear resonance near 3.3 MHz, with the phase transitioning to about -178°.

IMPEDANCE ROADMAP
FRA-100's impedance path will use a four-terminal vector-cancellation balanced bridge: two DACs excite the DUT and two ADCs measure voltage and current. A fast iterative loop drives LP toward zero (virtual ground), and the complex voltage/current ratio yields impedance. The four-terminal connection reduces lead effects, vector cancellation reduces dependence on a 50 Ω reference, and the iterative loop shortens settling time. This is a development-stage route, not yet validated on real hardware.
Swipe to see the full diagram

HC/HP/LC/LP separate the current loop from voltage sensing, reducing lead and fixture parasitics.
DAC2 drives the high side; DAC1 drives the low side through a sense resistor. A fast iterative loop adjusts DAC1 amplitude and phase until LP approaches 0 V (virtual ground), shortening settling time.
ADC2 measures the DUT voltage; ADC1 switches between the sense-resistor voltage (for current) and the LC null. Z = V_HP / I_sense gives both |Z| and phase.
The current prototype implements two-channel gain/phase sweeps only; this impedance route has not been validated on real hardware. Calibration, fixture de-embedding, and range extension will follow.
WHAT'S NEXT
These functions are not yet validated on real hardware. They are marked in development or planned, and are not current specifications.
A four-terminal vector-cancellation balanced bridge (HC/HP/LC/LP): a fast iterative loop drives LP to 0 V, then Z = V/I.
In developmentOpen/Short/Load/Thru plus cable and fixture compensation, moving the reference plane to the DUT pads.
In developmentS-parameters with Smith/Nyquist displays for more complete network analysis.
PlannedTarget frequency range 1 Hz–120 MHz; final values will be based on measured performance.
Planned
UI illustration; the chart shows measured data. Only the Bode mode is currently available; Impedance and VNA tabs are not enabled.
SOFTWARE
The Windows host app connects over IP, configures sweeps, displays dual traces, reads cursors, and exports data. The interface stays tool-like and quiet, keeping attention on the measurement.
SPECIFICATIONS
We separate what has been validated from what is still in development, so planned capability is never presented as a current specification.
Swipe horizontally to see the full table
| Item | Current prototype | Target / planned |
|---|---|---|
| Measurement method | Stepped sine, two-channel ratio | — |
| Frequency range | 10 Hz–1 MHz default, verified to 10 MHz | 1 Hz – 120 MHz (target) |
| Receiver bandwidth | 1 Hz–5 kHz | TBD |
| Sweep points | 201 default, 20,001 maximum | TBD |
| Source | Internal DAC sine, adjustable level (not calibrated in dBm) | Calibrated level |
| Interface | 1 GbE, TCP 5025 SCPI | TBD |
| Host software | Windows | TBD |
| Data export | CSV, PNG | Reports, Touchstone (planned) |
| Impedance | — | Vector-cancellation balanced bridge, HC/HP/LC/LP (in development) |
| Calibration | — | OSL/Thru + fixture de-embedding (in development) |
| VNA | — | Full two-port S-parameters (planned) |
The current prototype is a bench validation platform and some functions are still being debugged. Target/planned items have not been validated on real hardware. Final specifications, appearance, and configuration are subject to change.
APPLICATIONS
From filters and loop stability to component impedance, FRA-100 capabilities will expand with each product stage.
Measure input-to-output transfer, -3 dB bandwidth, resonance, and phase shift.
Measure loop gain and phase margin; an injection transformer is required.
Four-terminal impedance measurements reveal equivalent series parameters and self-resonance.
Tell us what you measure and over which frequency range. We will assess whether the current prototype fits and discuss joint testing or customization.